What is R-Squared?
R-squared () is a metric that measures how much of the variance in the actual data is captured by a model’s predictions. It’s most commonly used in evaluating linear regression models, but it can also be applied to non-linear models.
The formula is:
Where:
- : Sum of squared residuals (errors between actual and predicted values)
- : Total sum of squares (errors between actual values and their mean)
- : Actual value at index
- : Predicted value at index
- : Mean of actual values
R-Squared Value Space and Interpretations
- : The model perfectly explains all variability in the data ().
- : The model explains none of the variability; predictions are no better than predicting the mean.
- : The model performs worse than simply predicting the mean.
- : The model explains part of the variance; the higher the better.
Limitations
Although is widely used, it can be misleading. A high does not always translate into a good model. Some pitfalls include:
1. Overfitting
A model can achieve a very high by overfitting the training data. This means it captures noise rather than general patterns, and will likely perform poorly on unseen data.
2. Coincidental Fits
Sometimes a model—especially a linear one applied to non-linear data—may still produce a high by coincidence. Similarly, including irrelevant but correlated features can inflate without improving real predictive power.
3. Increasing Complexity
always increases or at least stays the same when you add more features, even if those features are irrelevant. This happens because there is more flexibility for optimization, allowing residuals to shrink.
This can feel abstract, so let’s look at it intuitively and mathematically.
Intuitive Justification
Adding more features increases the dimensionality of the model, giving it more flexibility to fit the training data. This flexibility usually lowers residuals, thereby increasing .
Mathematical Justification
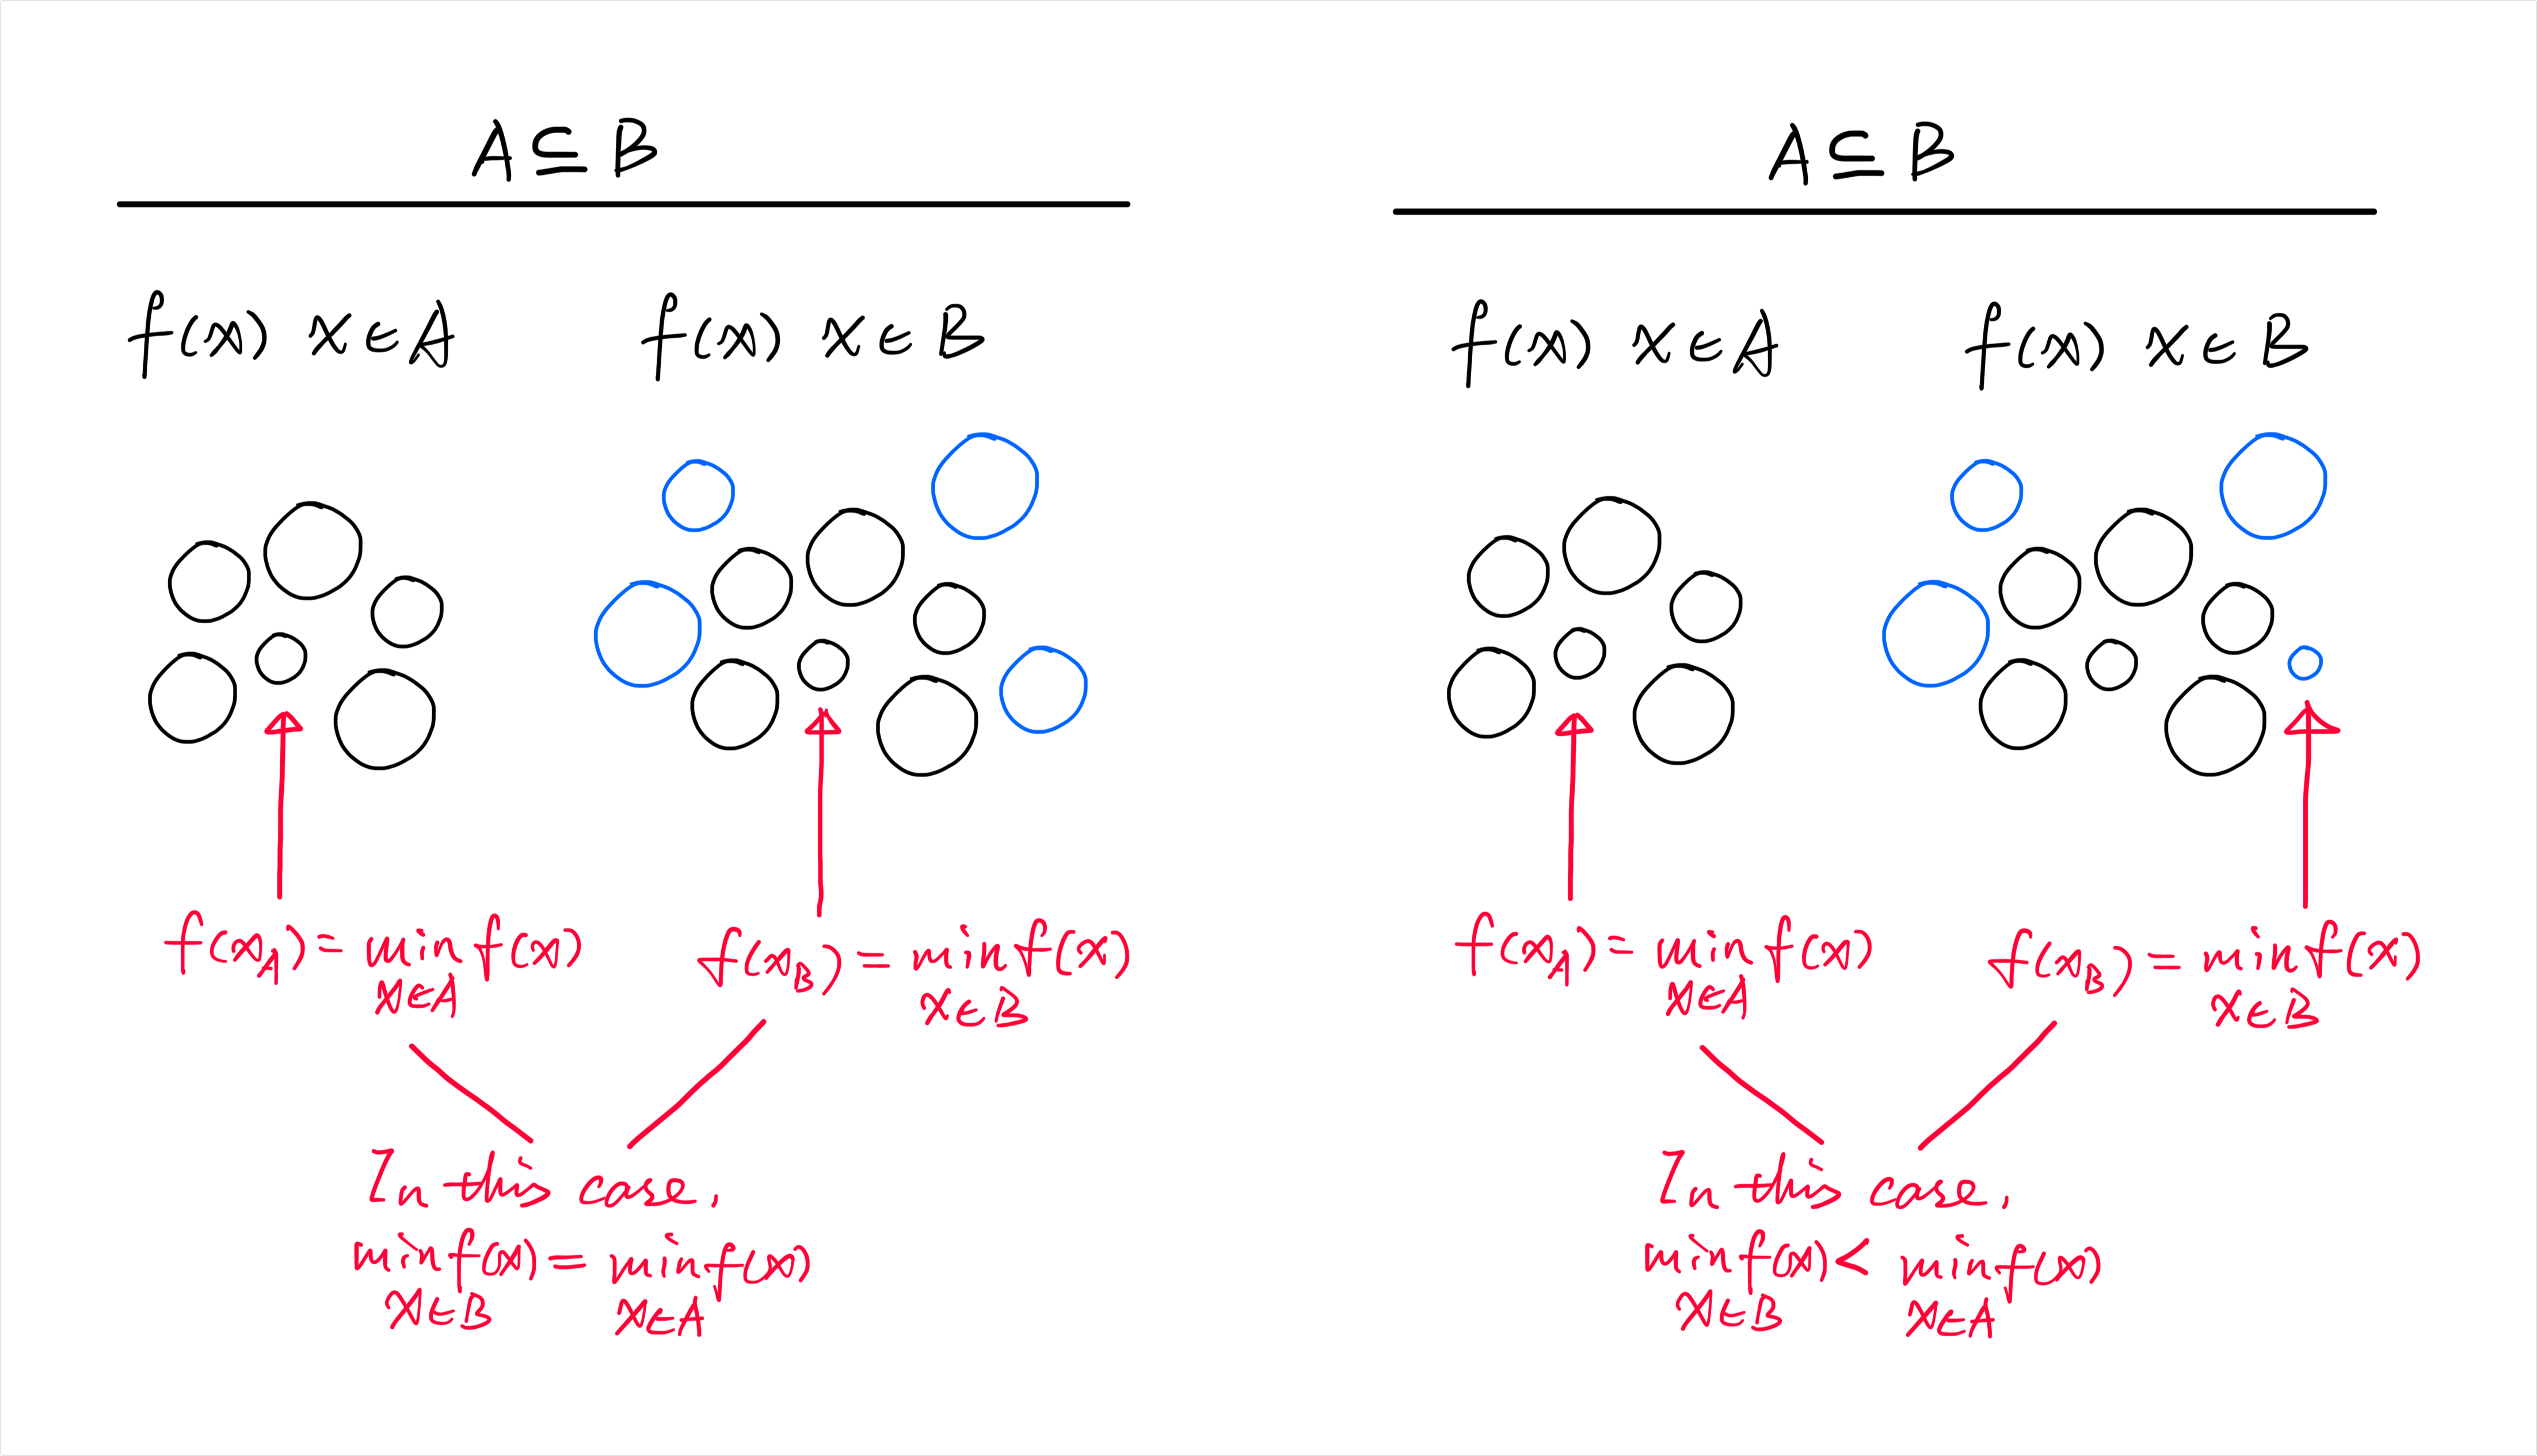
Here’s one way to visualize it:
- Let be a subset of a larger set .
- If makes , then because , cannot be worse—it’s either the same or better.
This extends naturally to regression with feature sets:
- : dataset with fewer features, with coefficient vector
- : dataset containing plus extra features, with coefficient vector
- Predictions: ,
We can always construct so that it reproduces by setting the extra feature coefficients to zero:
Thus:
- If the added features are useless, the residual sum of squares stays the same ().
- If the added features do help, the residuals shrink ().
Either way, never decreases when adding features.
Conclusion
is a helpful metric for understanding how well a model fits training data, but it must be interpreted with caution. A high can be the result of overfitting, coincidental correlations, or simply adding more features. For a more reliable assessment, should be used alongside other metrics and validation techniques. I’ll be covering these complementary approaches in upcoming articles, so stay tuned!