
- The problem: "2% used", so what?
- Design experiments to find a solution
- Discussion
- Limitations
- What I'd do next
- Wrapping up
- References
I check my AI usage far more often now than when I first started using AI in my work and daily life. Yet in most AI apps, that information is buried two or three clicks deep in a settings panel, and when I do find it, it rarely answers the question I actually have.
This post is about a small design experiment that came out of that frustration: a usage "fuel gauge" that sits where the work happens and translates a percentage into tasks. The short version: showing usage in human terms is the right goal, but "tasks left" is a range, not a number, and providers have real reasons to keep the meter vague. A good usage UI has to be honest about both.
The problem: "2% used", so what?
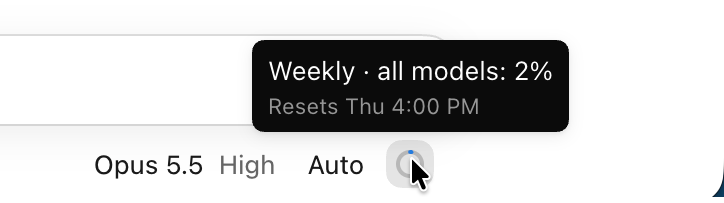
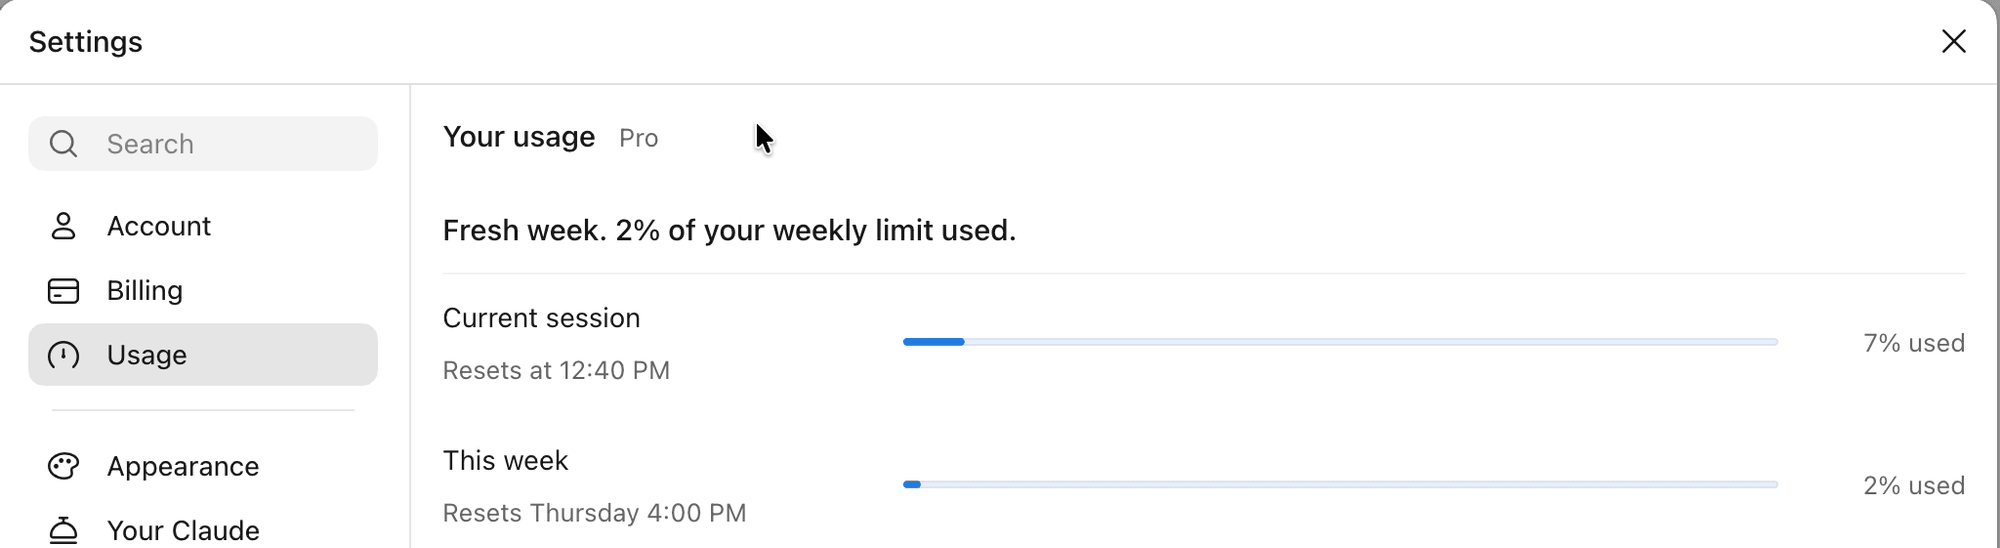
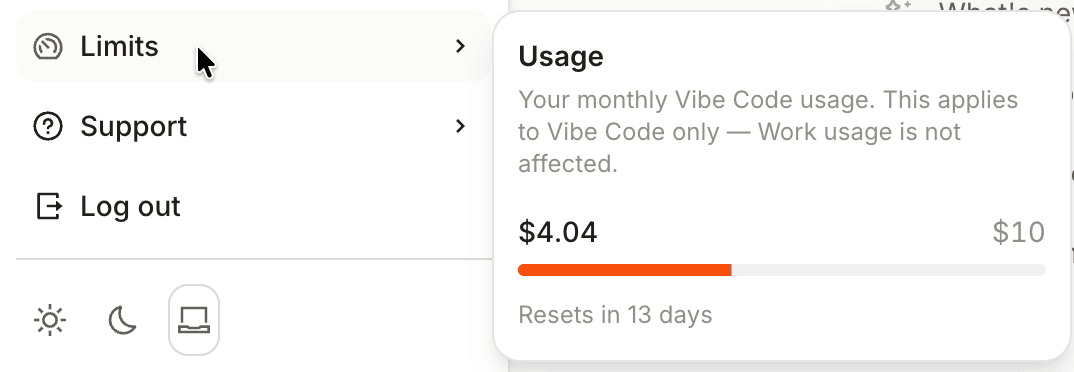
Mid-task in Claude Code, I hover over the little ring next to the model picker and get something like "Weekly · all models: 2%". Clicking it shows a little more: the 5-hour and weekly limits, each with a reset time. In the main Claude app, the same information lives in a Settings modal, two or three clicks away. In Mistral Vibe, it's in a flyout that only appears when I click my account avatar and hover over "Limits", and it only covers Vibe Code spending.

| Product | Where it lives | To reach it | What it shows | What it can't tell me |
|---|---|---|---|---|
| Claude app | Settings → Usage | 2–3 clicks | % of session and week, with reset times | What's left in terms of work |
| Claude Code (desktop) | Ring next to the model picker | Hover, or 1 click | Hover: weekly %. Click: 5-hour and weekly % | What that % means for the task in front of me |
| Mistral Vibe | Avatar → Limits | 2 clicks | Dollars spent on Vibe Code; nothing for Work (fair use) | What either one buys in work |
The pattern is almost exactly backwards: the closer to the work, the less information; the more information, the further from the work. And the question I actually care about isn't what percentage of the quota is used, but "can I finish this before the reset?" None of these screens answers that.
Recently, I came across an article by Arin Bhowmick on UX Collective that put words to this frustration. It calls budget anxiety and bill shock UX failures, which captures what I've been experiencing: on top of budgeting my time, I now have to budget my tokens. The article treats cost as a design material, like latency or error states, and lists practices it considers non-negotiable, including putting the estimate next to the button, showing what each task cost, and warning early. It also floats the idea of telling people they have "enough for about three more prototypes like this one" instead of a bare credit count. Where I agree most is its point that, for Copilot users, the worst part wasn't the price but not knowing the cost in advance.
The GitHub Copilot billing switch the article mentions is one I experienced first-hand, on the free Copilot Student plan. In March 2026, GitHub removed Claude Opus, Claude Sonnet and GPT-5.4 from the Student plan's model picker, so the more powerful models I was used to were gone overnight. Then on 1 June, Copilot replaced premium requests with metered AI Credits (200 a month on the Student plan), and I still remember how frustrated I felt when I burned through half of my monthly credits in a day without knowing it. The old safety net went with the switch: running out of premium requests used to drop you to a cheaper model, but once AI Credits run out, Copilot's chat and agent features simply stop unless you pay for more. Cursor went through its own version in 2025, ending with an apology and refunds for surprise charges.
Design experiments to find a solution
I ran several design experiments, some by hand and some with Claude Design, to explore how existing AI interfaces could be more transparent about usage.
My idea: a usage popover at the point of work
I was most interested in the relatable-framing idea. The key was to give context on what, and how much, the remaining quota can still do, rather than leaving me with a raw number like "42 credits" or "60% used". My initial idea looked like this:
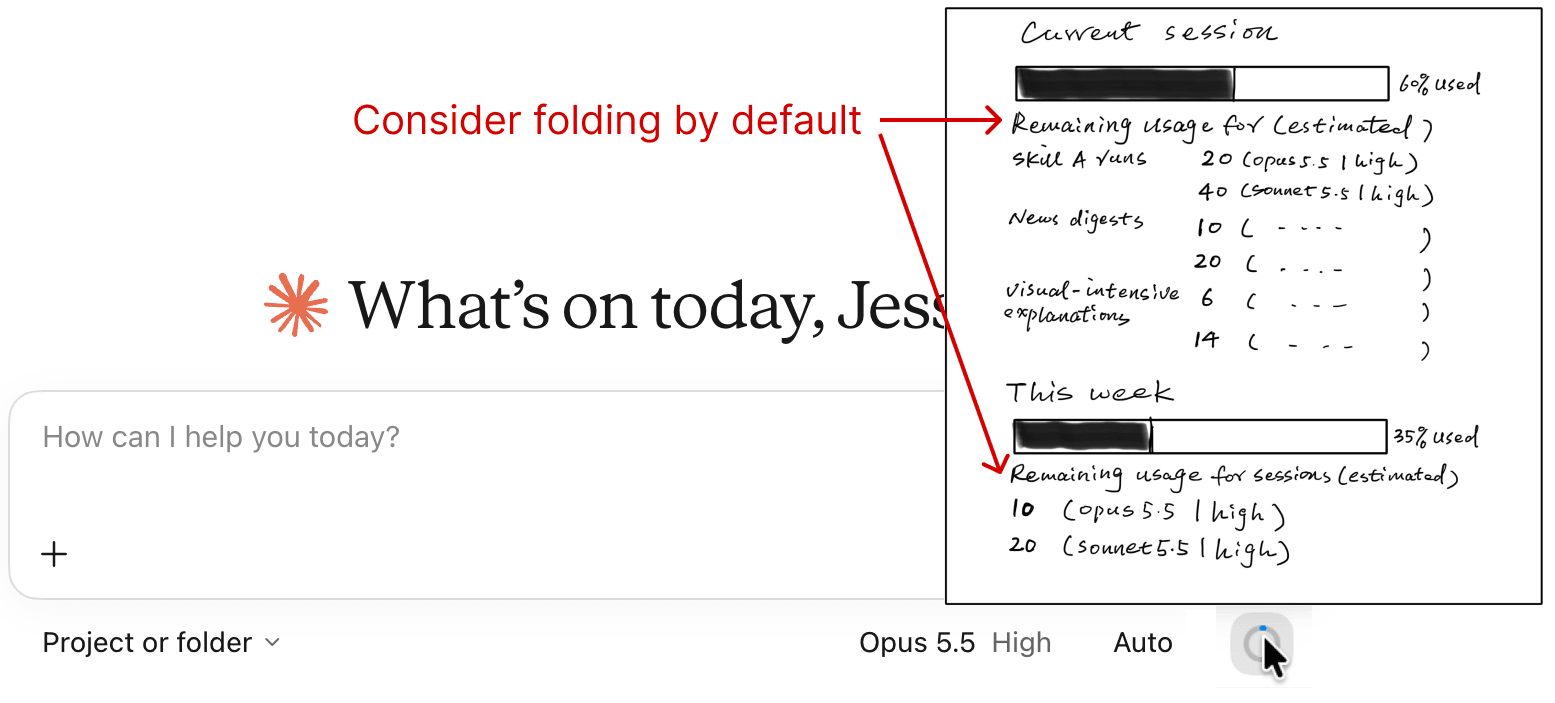
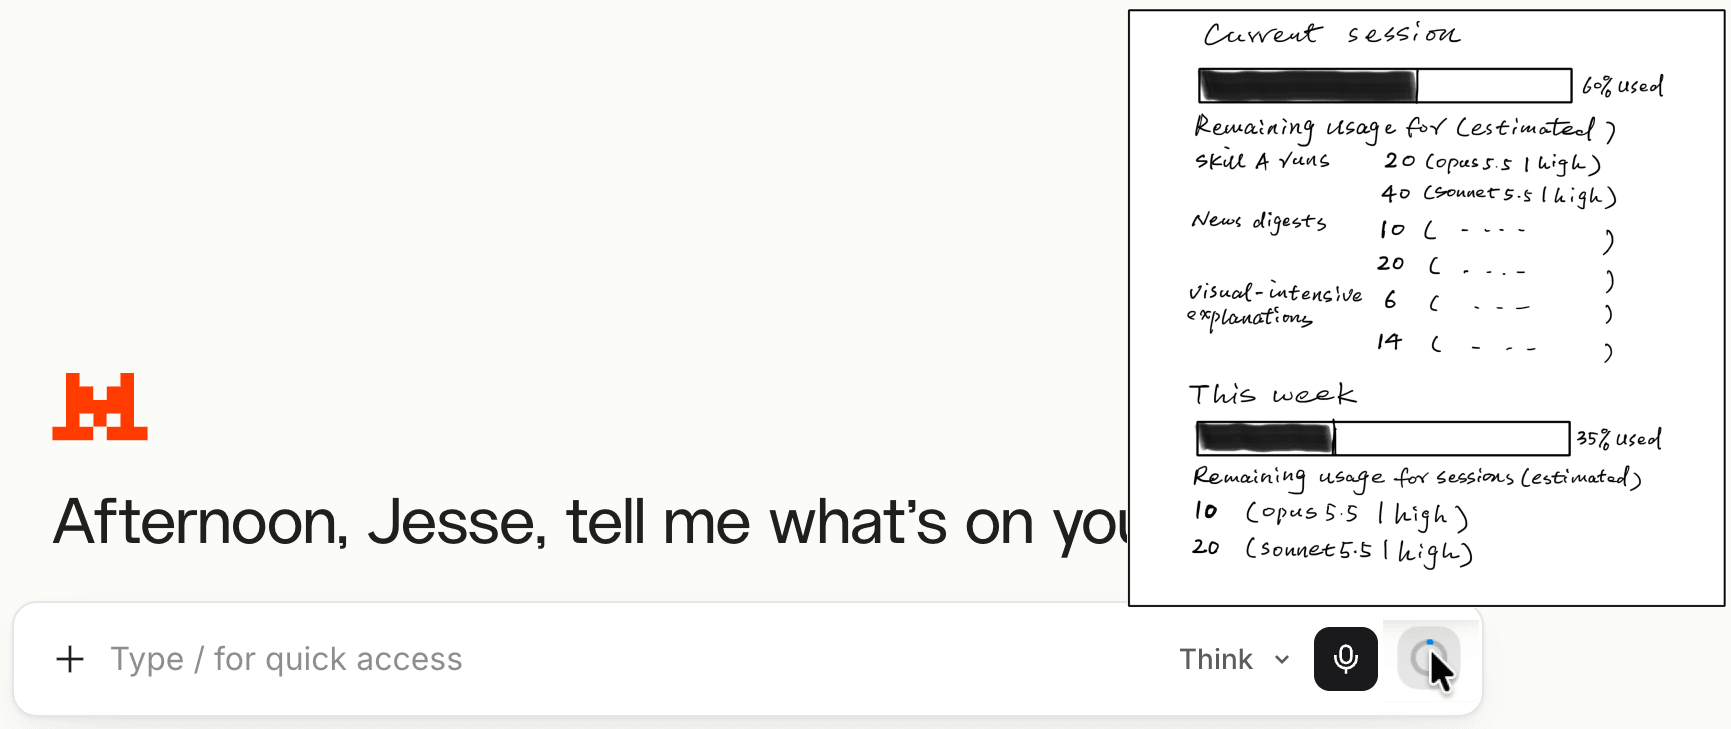
Claude Code already has a ring icon with a basic usage breakdown, so I borrowed it for the main Claude app and Mistral Vibe. The change was what the popover holds: an estimate of how many of my usual tasks (skill runs, news digests, visual explanations) the remaining quota covers, on each model I use.
Three decisions shaped it, and here's how I'd now defend or revise each:
- Temporary, not modal. Usage is a glance, not a task. What I'd revise: tooltips aren't meant to hold controls, and hover content has to stay visible while hovered and be dismissible (WCAG 1.4.13), so it becomes a small popover that opens on hover and click and closes on Esc.
- Instantly accessible. It sits next to the model picker, where the cost decision happens. What I'd add: the ring should show whichever limit is tighter right now.
- Detailed but strictly useful, and personalised. The tasks and models come from my own history. What I'd revise: fold the estimates by default (a note on my own sketch), show at most two model/effort columns, and highlight the one selected in the composer. The point is not to help me choose a model; it's to help me estimate what I can still get done.
I sketched this by hand in iPad Freeform, using Figma only as a canvas to organise the screens. It was quick; the goal was to check the idea against a realistic UI before deciding whether to take it further.
Claude Design for broader and deeper exploration
I thought my idea was promising but needed validating, so I asked Claude to run deeper benchmark research on similar patterns, partly to find opportunities I didn't know about, and partly to surface business constraints behind the existing UIs.
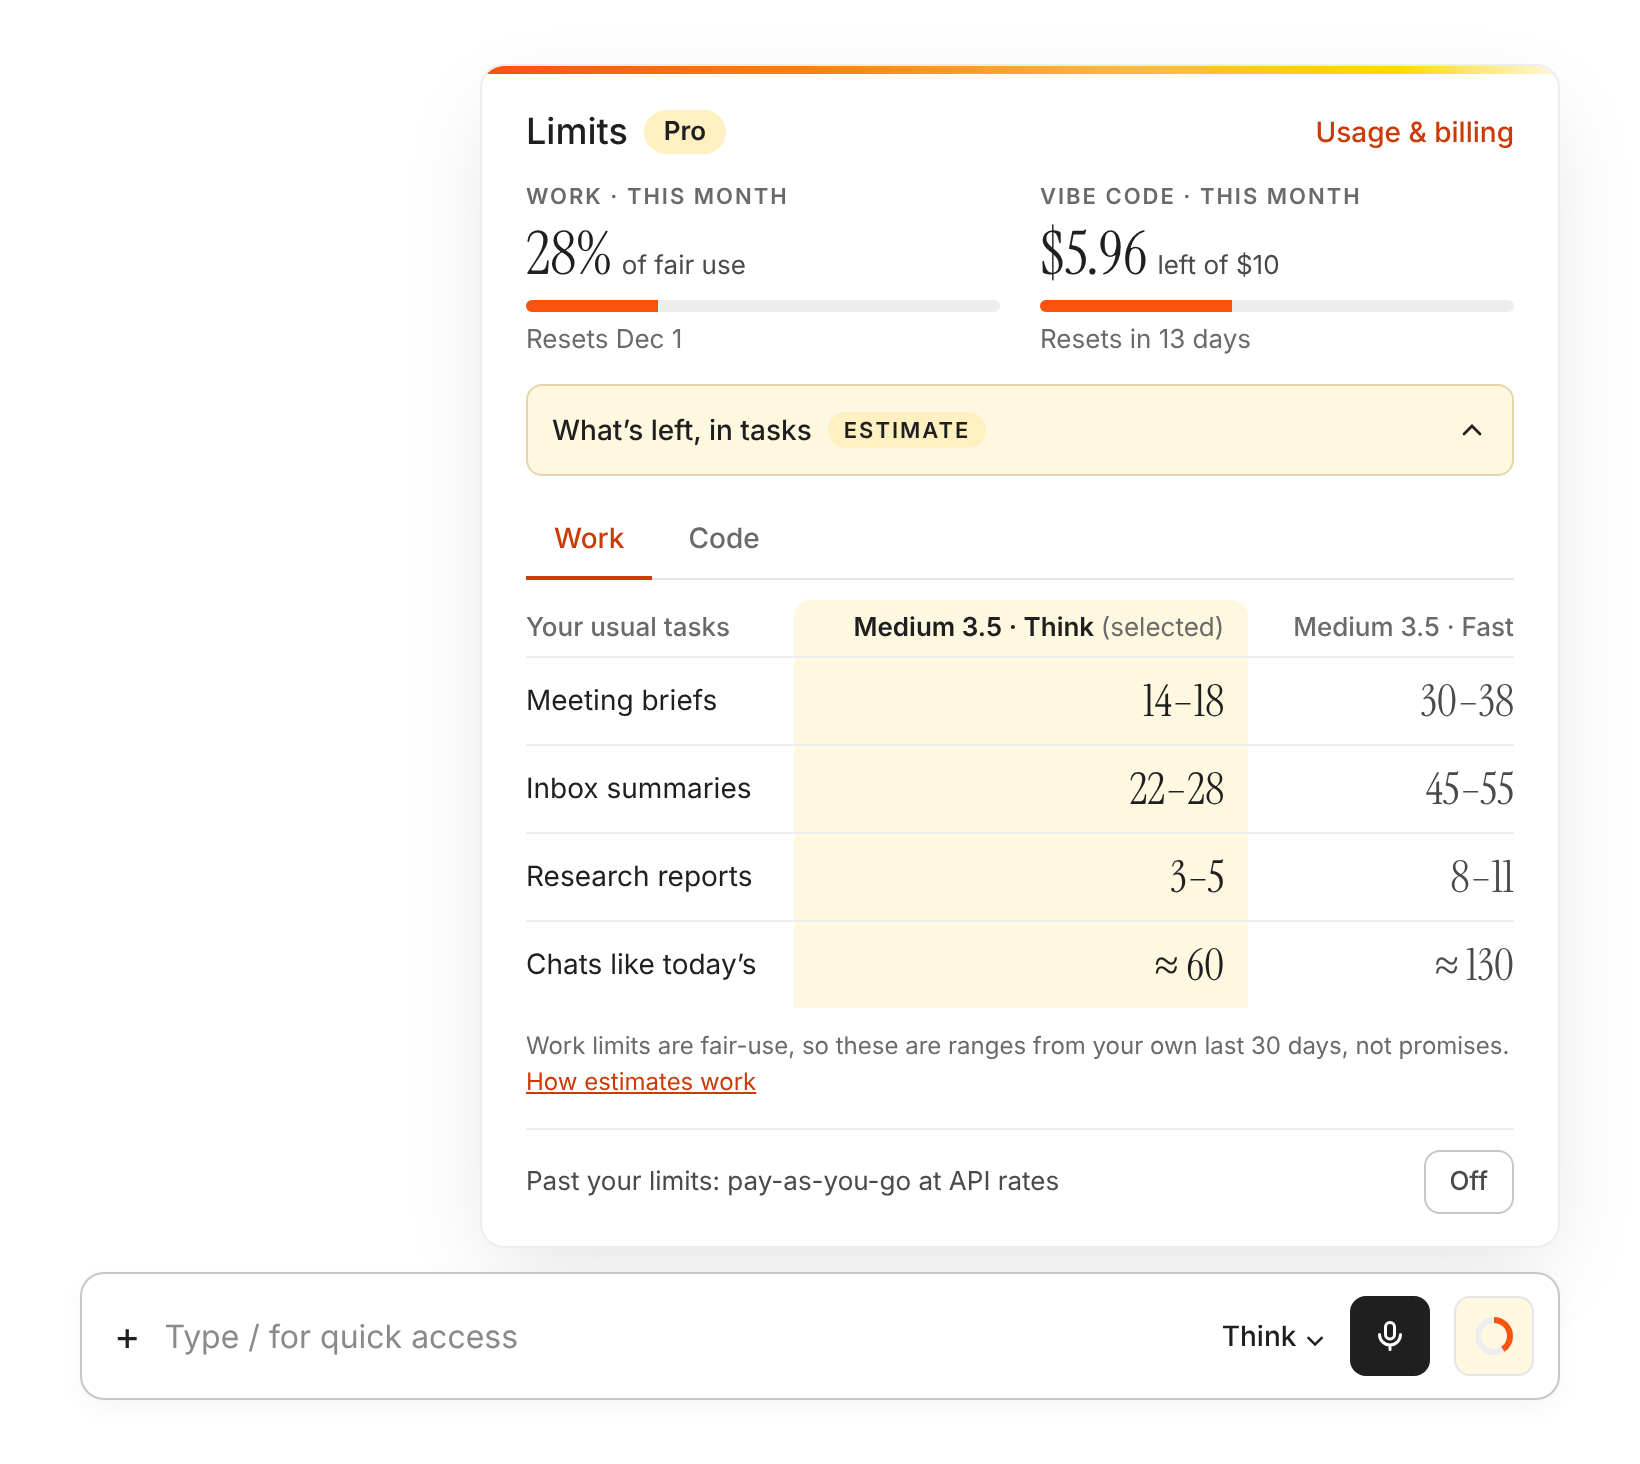
Two things came back. The first was a higher-fidelity version of my popover for both products, each in its own design system:
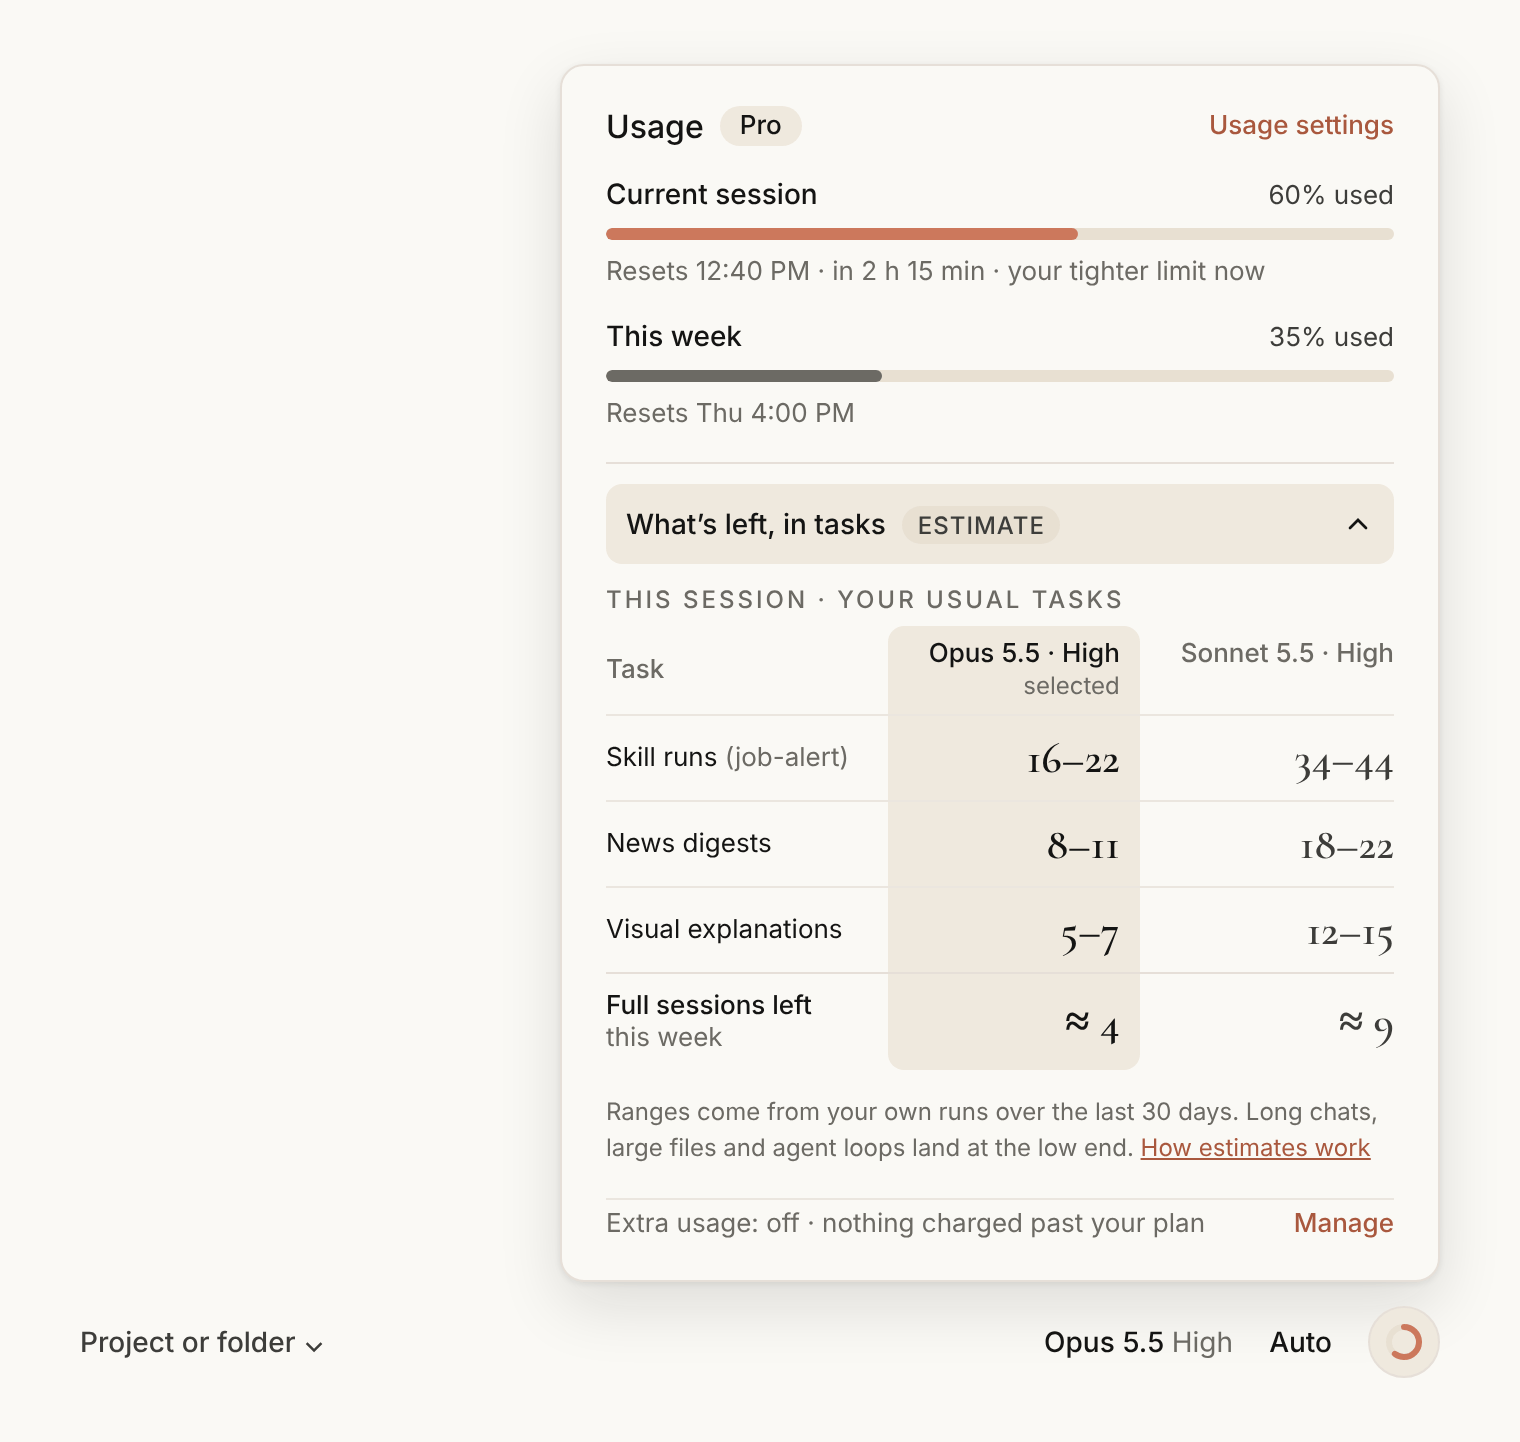
The Mistral version turned out to be more than a reskin. Vibe meters two currencies, Work as a percentage of fair use and Vibe Code in dollars, so the popover needs two meters and Work/Code tabs, and "effort" maps to Vibe's existing Think/Fast control. A pattern only ports across products if it respects each product's pricing model, not just its look.
The second was a lookbook of eight patterns that go beyond the meter:
- Quote before you send: a cost range for a message, only when it's large.
- Plan and cap agent runs: an estimate for the plan, a cheaper route, and a cap that stops and asks.
- Receipts that teach: a breakdown after the run, with one tip.
- Pace, not price: when I'll run out at my current pace.
- Downshift, don't dead-end: an 80% alert with a cheaper model instead of a wall.
- Stop at a safe point: no cut-off mid-task.
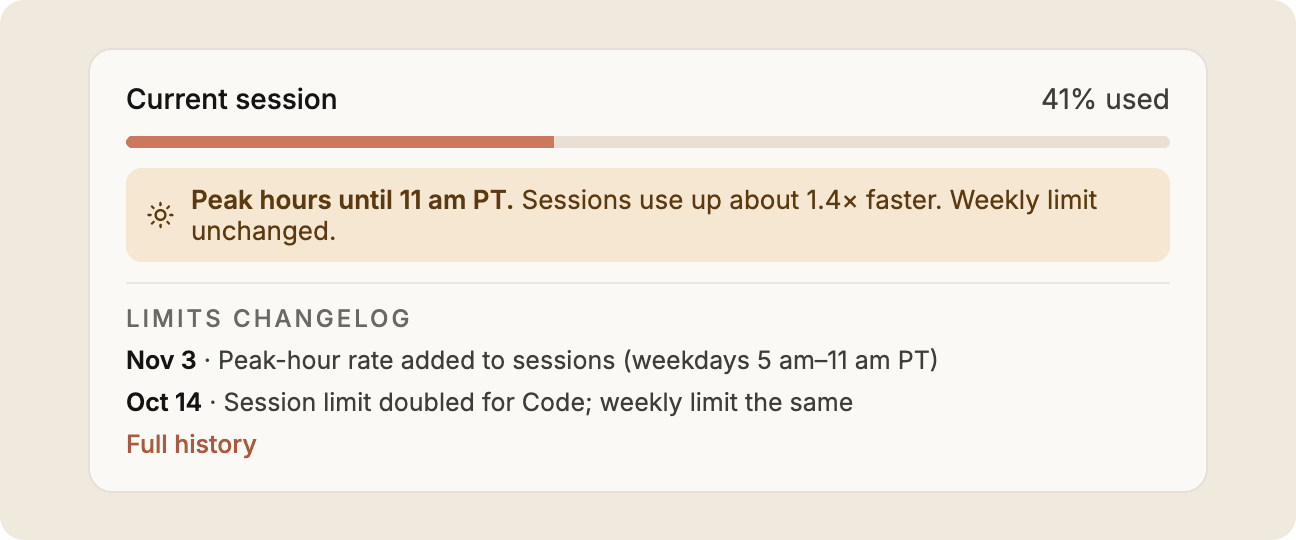
- Limits weather report: a peak-hour notice and a dated changelog of limit changes.
- Fixed-price task menu: the provider absorbs the variance for repeatable tasks.
Five of them (1, 3, 4, 7 and 8) come up in the discussion below.
Discussion
The lessons apply to any AI product with usage limits. Three stood out.
"Tasks left" is a range, not a number
A catch I hit while sketching was that "three more prototypes" depends on a lot: the type of task, how long the conversation already is, attached files, the model and effort level, tool calls and agent loops, cache hits, even peak-hour multipliers. My sketch showed single numbers ("20 skill runs"), but any count of tasks left is really a point estimate of a wide spread. Showing it as fact sets up a broken promise the first time a long chat lands at the low end.
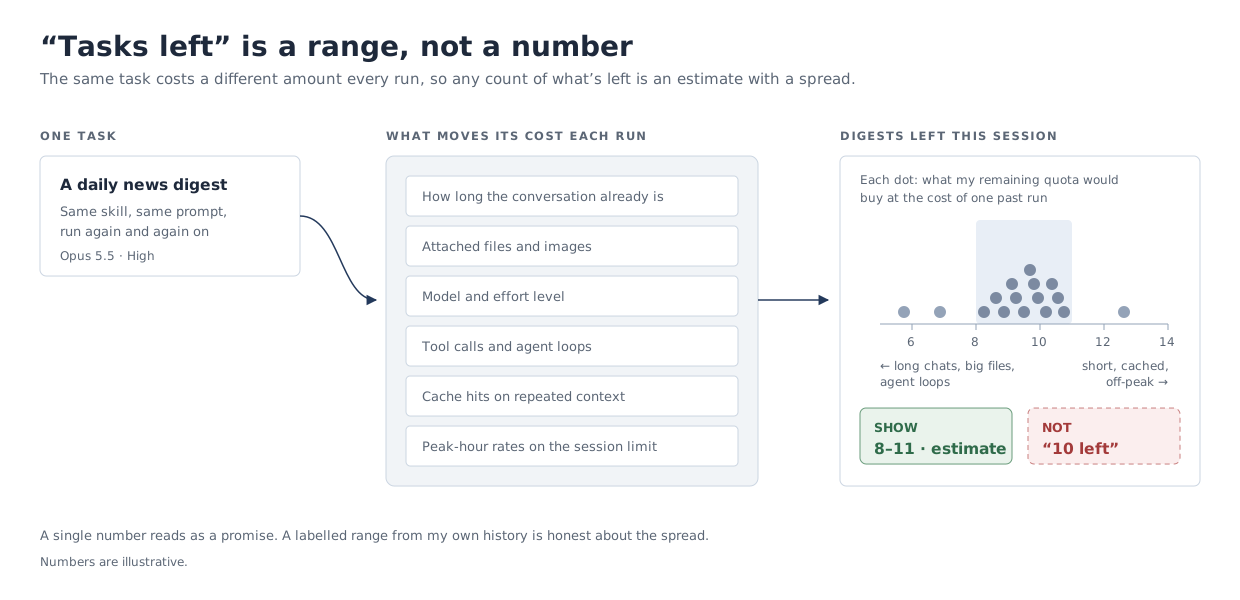
The most useful change Claude made to my idea was how it handled this:
- Ranges, not single numbers: "16–22" rather than "20", under an Estimate label.
- Personal history, not global averages: already part of my idea, and it narrows the spread, because my own runs vary less than everyone's.
- The method one click away: a "How estimates work" link explains where the numbers come from.
- A plain-language caveat: the footnote says what pushes a task to the low end (long chats, large files and agent loops), so I know when to read the lower number.
Two patterns in the lookbook deal with the same variance from opposite ends of a prompt, and they line up with two of the article's non-negotiables: put the estimate next to the button, and show what each task cost.
Quote before you send puts a cost range next to the send button, but only when a message is big enough to matter.
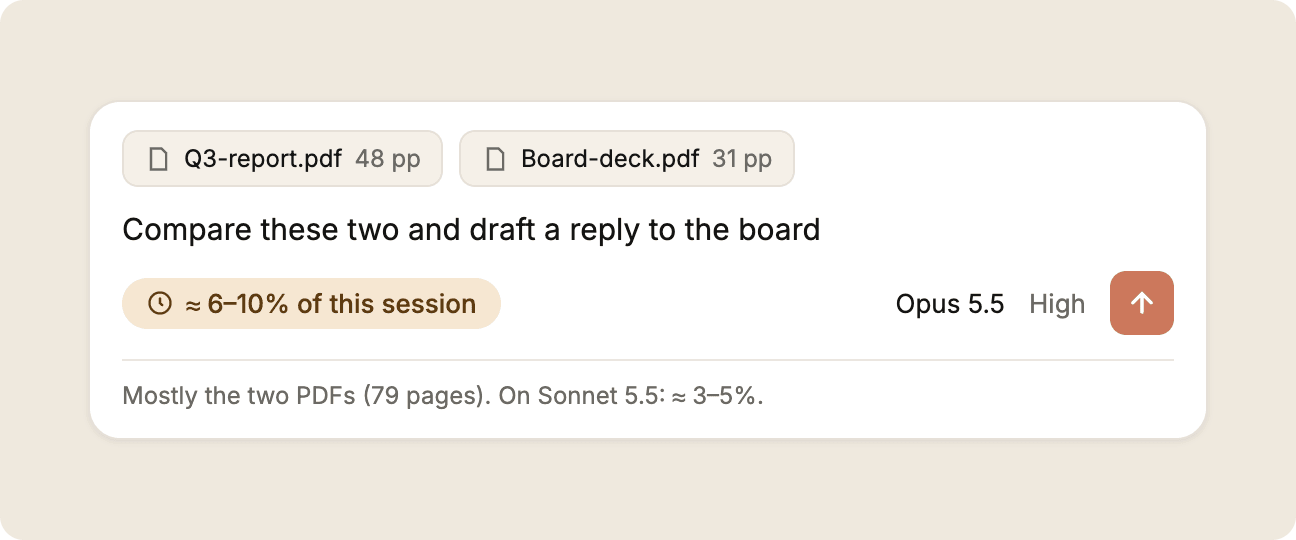
It's the most useful moment to know the cost, because I can still change course: trim the attachments, or switch to the cheaper model the quote has already priced. It's also the hardest moment to be accurate. A message with two PDFs is fairly predictable; an agent run that decides for itself how many files to read is not, so the range gets either too wide to be useful or too narrow to be honest. Shown too often, it becomes the taxi meter the article warns about. For the provider, it means maintaining a pre-run estimator for every model, and it nudges people to send less.
Receipts that teach works after the run: what the task actually cost, what drove it, and one tip for next time.
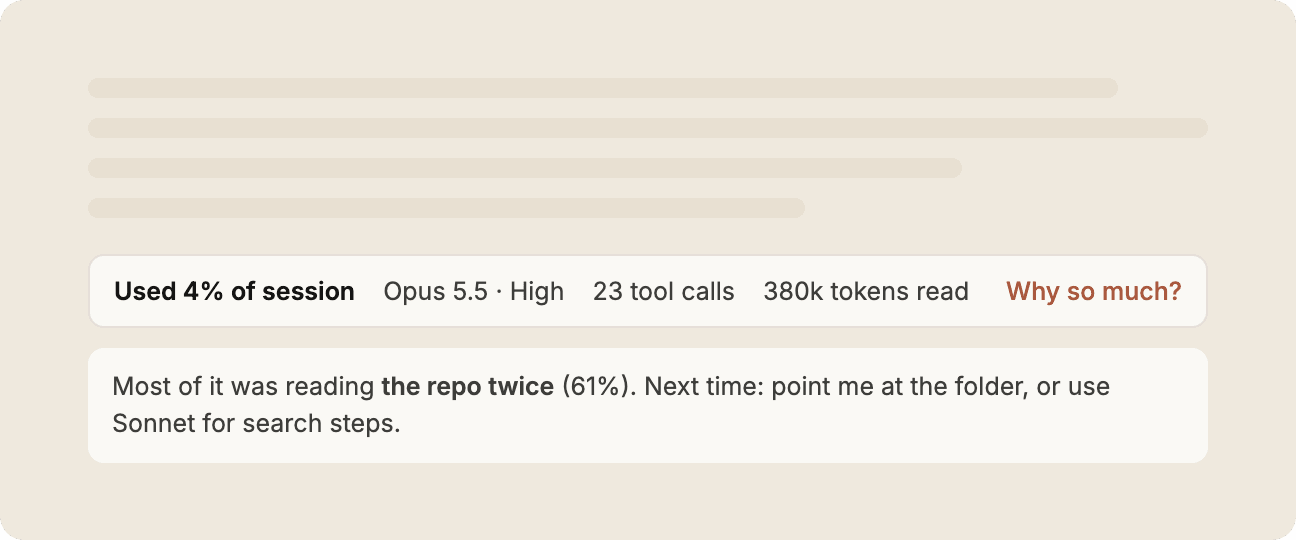
A receipt has no estimation problem, because the numbers are exact, and it's cheap for the provider, which already meters every run (the article mentions Replit, which shows each checkpoint's cost on hover). The downside is timing: by the time I read it, the usage is gone. Its value is cumulative: each receipt teaches me what makes my tasks expensive and adds to the history that narrows the next estimate.
So I see the two as a pair rather than alternatives. The receipt is cheap and exact but late; the quote is timely but uncertain and costlier to build. The receipts are what keep the quotes honest.
Why the meter is buried
Another important point Claude raised was cost to the provider: if a usage UI is costly to build or undermines the provider's revenue model, it won't ship, however good it is for users. And user trust and provider revenue pull in opposite directions here: being honest with users gives them more control over their usage, which naturally reduces revenue.
My hunch is that there are less visible reasons usage information sits so deep in the UI. I have no inside knowledge, so treat this as a hypothesis, but the economics and the public record make it plausible:
- The taxi-meter effect. Lambrecht and Skiera (2006) found that many people pick a flat rate even when paying per use would be cheaper, partly because they enjoy a service more when it isn't visibly tied to paying, and that this bias didn't significantly raise churn. An always-visible meter works against a flat subscription's perceived value.
- Breakage. Prepaid credits that go unused still count as revenue. A precise "37 tasks left" is a nudge to use them up.
- Flexibility. Limits that aren't published in concrete terms can be tuned without announcing a price change. Anthropic reserves the right to apply other caps "at our discretion", and in March 2026 confirmed that session limits now run down faster at weekday peak hours. Mistral describes Vibe Pro's allowances as multiples of a Free plan whose limits aren't published.
Some of this is natural and partly justifiable. Capacity is finite, compute costs swing, and publishing task-equivalents creates a promise that's hard to change later. Providers aren't villains; a vague meter is a rational choice. But it carries a trust cost that arrives anyway, as Cursor and Copilot both found. Telecoms learned this more than a decade ago: "bill shock" led the EU's 2009 roaming regulation to require an alert at 80% of a data-roaming limit, and in 2011 US carriers covering about 97% of subscribers agreed, under FCC pressure, to send usage alerts.
There's a middle path: be honest about the flexibility instead of hiding it. That's the idea behind the limits weather report. It doesn't promise fixed limits; it tells me when peak-hour rates are on and keeps a dated log of what changed.
What's realistic
Every design I explored carries some risk for the provider, and the ones that cost least are closest to what providers already do. Two patterns from the lookbook sit at opposite ends of that scale.
Pace, not price forecasts when I'll run out at my current pace, and the daily pace that would last until the reset.
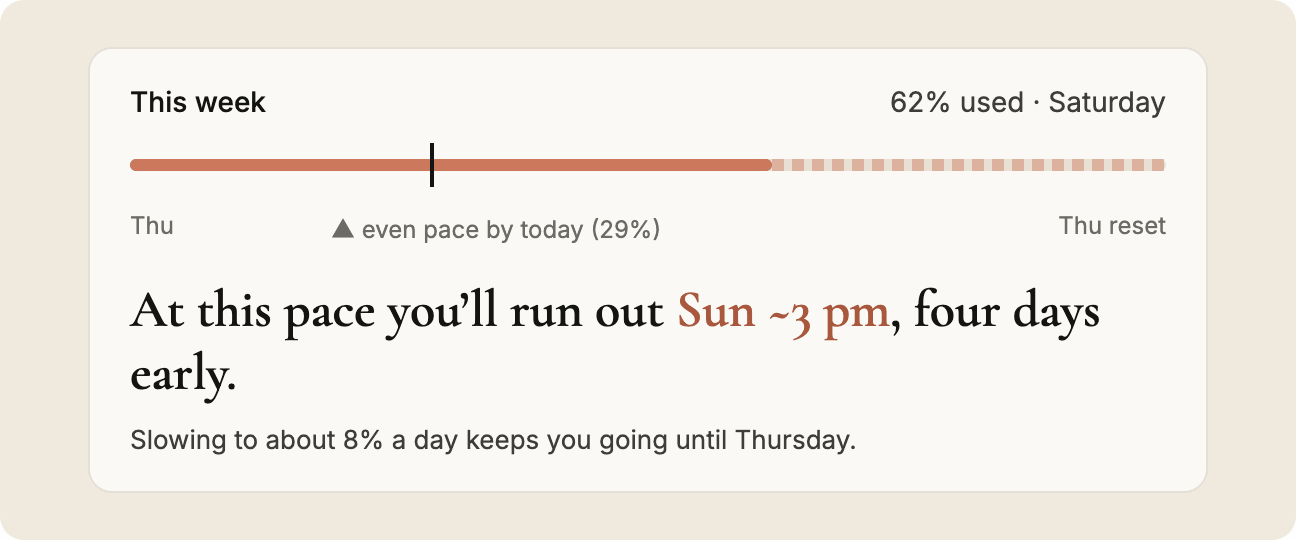
Its inputs (how much I've used and when it resets) are already on screen; it just does the arithmetic, so it costs the provider very little. It also sidesteps the range problem, because working from my overall burn rate lets time absorb the variance between tasks. But it can't tell me whether this task will fit, or why I'm burning fast. It answers "when will I run out?", not "can I finish this?".
A fixed-price task menu is the opposite. It's the only way to make relatable framing literally true: the provider charges a set amount per repeatable task and carries the variance itself.
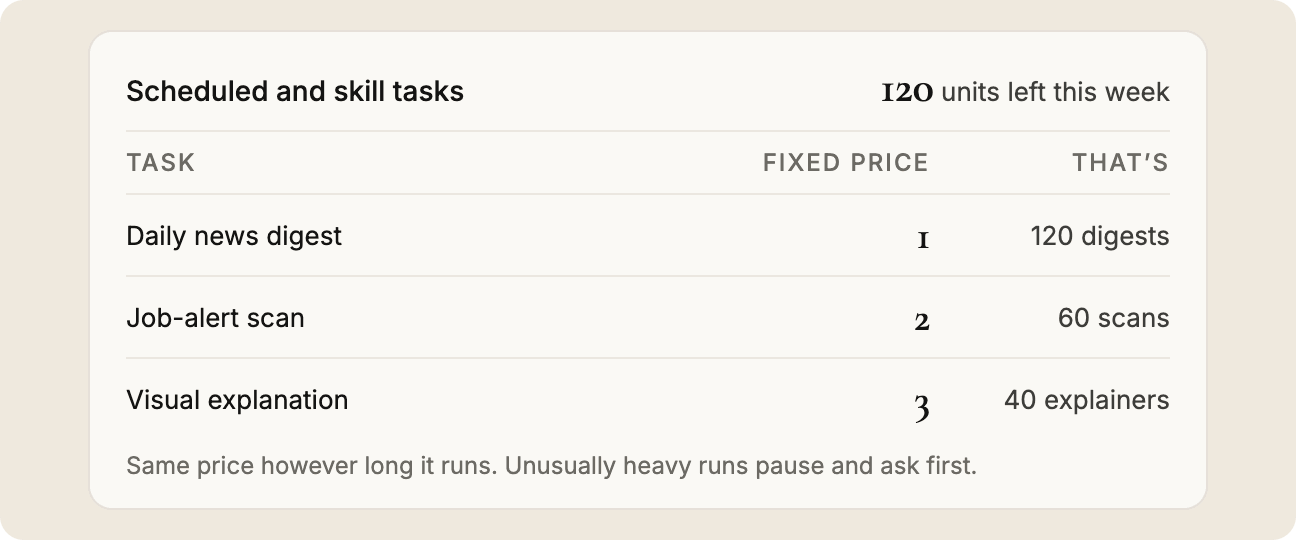
For me, that's the most certainty any of these designs offers. For the provider, it's the most exposure: every unusually heavy run is a loss, so prices have to sit above the average, heavy runs need a guard (the mockup pauses and asks), and it only works for tasks repeatable enough to price. I'd probably pay more per task in exchange for knowing the price.
My own popover sits between the two: more certainty than a pace forecast, without promising a fixed price, but it still needs an estimator, my history, and a provider willing to show how far the quota goes. Across all of these, the more certainty a pattern gives users, the more it tends to cost the provider, in engineering or in revenue.
The implication seems to be that it makes sense for AI vendors not to offer this kind of transparency in full. So I now read the native mockups in this post as a benchmark for what a provider could ship, and see a third-party layer (a plugin, a hook or a status line built around the service) as what builders can ship today without waiting for permission. The pieces already exist: Claude Code can show a custom status line driven by a script, and open-source tools such as ccusage already turn its local session logs into usage and cost reports, with a status-line mode of their own. Built from local logs, a layer like that is strongest at the cheap, honest end of the scale: receipts for each task and a pace forecast.
Limitations
- Every number in the mockups is illustrative; I have no real per-task cost data.
- No user testing yet, so I don't know whether people read ranges correctly or find them reassuring.
- Personalisation means analysing activity history, a privacy question (opt-in? on-device?) I didn't design for.
- The UI can only be as honest as the estimation model behind it, and that's an engineering problem.
- The provider-incentive section is inference, not insider knowledge, and the screenshots come from one account on one plan in November 2026.
- The sketches and design decisions are mine. Claude did the benchmark research and produced the higher-fidelity mockups and the lookbook in Claude Design.
What I'd do next
- Build the third-party version first. A status-line gauge for Claude Code, fed by the local session logs
ccusagealready reads, could show a receipt for each task and a pace forecast. Logging tokens per task would also show whether my per-task ranges are stable enough to display. Anthropic doesn't publish how tokens map to the plan's usage percentage, so I'd calibrate that by watching how far the usage bar moves. - Run a five-person test. Show the folded and expanded popover and ask: "Could you finish X before the reset?"
Wrapping up
The useful meter isn't the most precise one. It's the one that answers "can I finish this?" honestly, including "probably; here's the range".
It was also a reminder that design is usually more complex than designers first expect; some constraints only surface once you start working on the problem. From the users' perspective, there are more poor usage UIs than good ones; from a business standpoint, a poor design that protects revenue is still a successful product. A good usage UI has to work for both, starting with honesty about what the meter can and can't promise.
References
- Lambrecht, A. & Skiera, B. - Paying Too Much and Being Happy About It: Existence, Causes, and Consequences of Tariff-Choice Biases (Journal of Marketing Research, 2006)
- Bhowmick, A. - Every click has a price now. Who designs how that “feels”? (UX Collective, 2026)
- GitHub - Important Updates to GitHub Copilot for Students (GitHub Community, 2026)
- GitHub - GitHub Copilot is moving to usage-based billing (GitHub Blog, 2026)
- Cursor - Clarifying our pricing (Cursor Blog, 2025)
- Anthropic - What is the Pro plan? (Claude Help Centre)
- The Register - Anthropic tweaks timed usage limits to discourage Claude demand during peak hours (2026)
- Mistral AI - Pricing
- FCC - Bill shock alerts (archived, 2012)
- ccusage (npm)